Tick tock on the clock & You've got mail

It's been a busy week for us! We have shipped something new (Scheduled Insights), iterated on Artifacts, and even went on a company offsite in the Bahamas. But enough about Bahamas, let's dive into the new stuff.

Scheduled Insights

Your AI Analyst can now work on semi-autopilot. Tell the analyst what to track, how often, and under what conditions it should bother you — and it will run on schedule, headless, every time.

When something interesting happens (revenue drops, a threshold is crossed, an anomaly shows up), it writes you a message. Nothing to track manually. No scheduled check-ins. Just an alert when the numbers warrant one.

To create a scheduled insight, open Explorer, start a conversation with your AI Analyst, and ask it to set up a schedule. The analyst parses your intent, sets the schedule, and that's it.

You might already be used to alerting in other BI tools, which allows you to get alerts whenever a specific condition triggers. With AI Analyst, you can take this one step further, and have it alert you based on subjective interpretations. Try these:

  • Check daily for new clients, and if they are from a Fortune 500 company, send me a message.
  • Every week, check our WAU numbers, and ping me for any anomalous changes.
  • Every morning at 8:50am CET prepare a morning brief for me.

Chat & Artifact Sharing
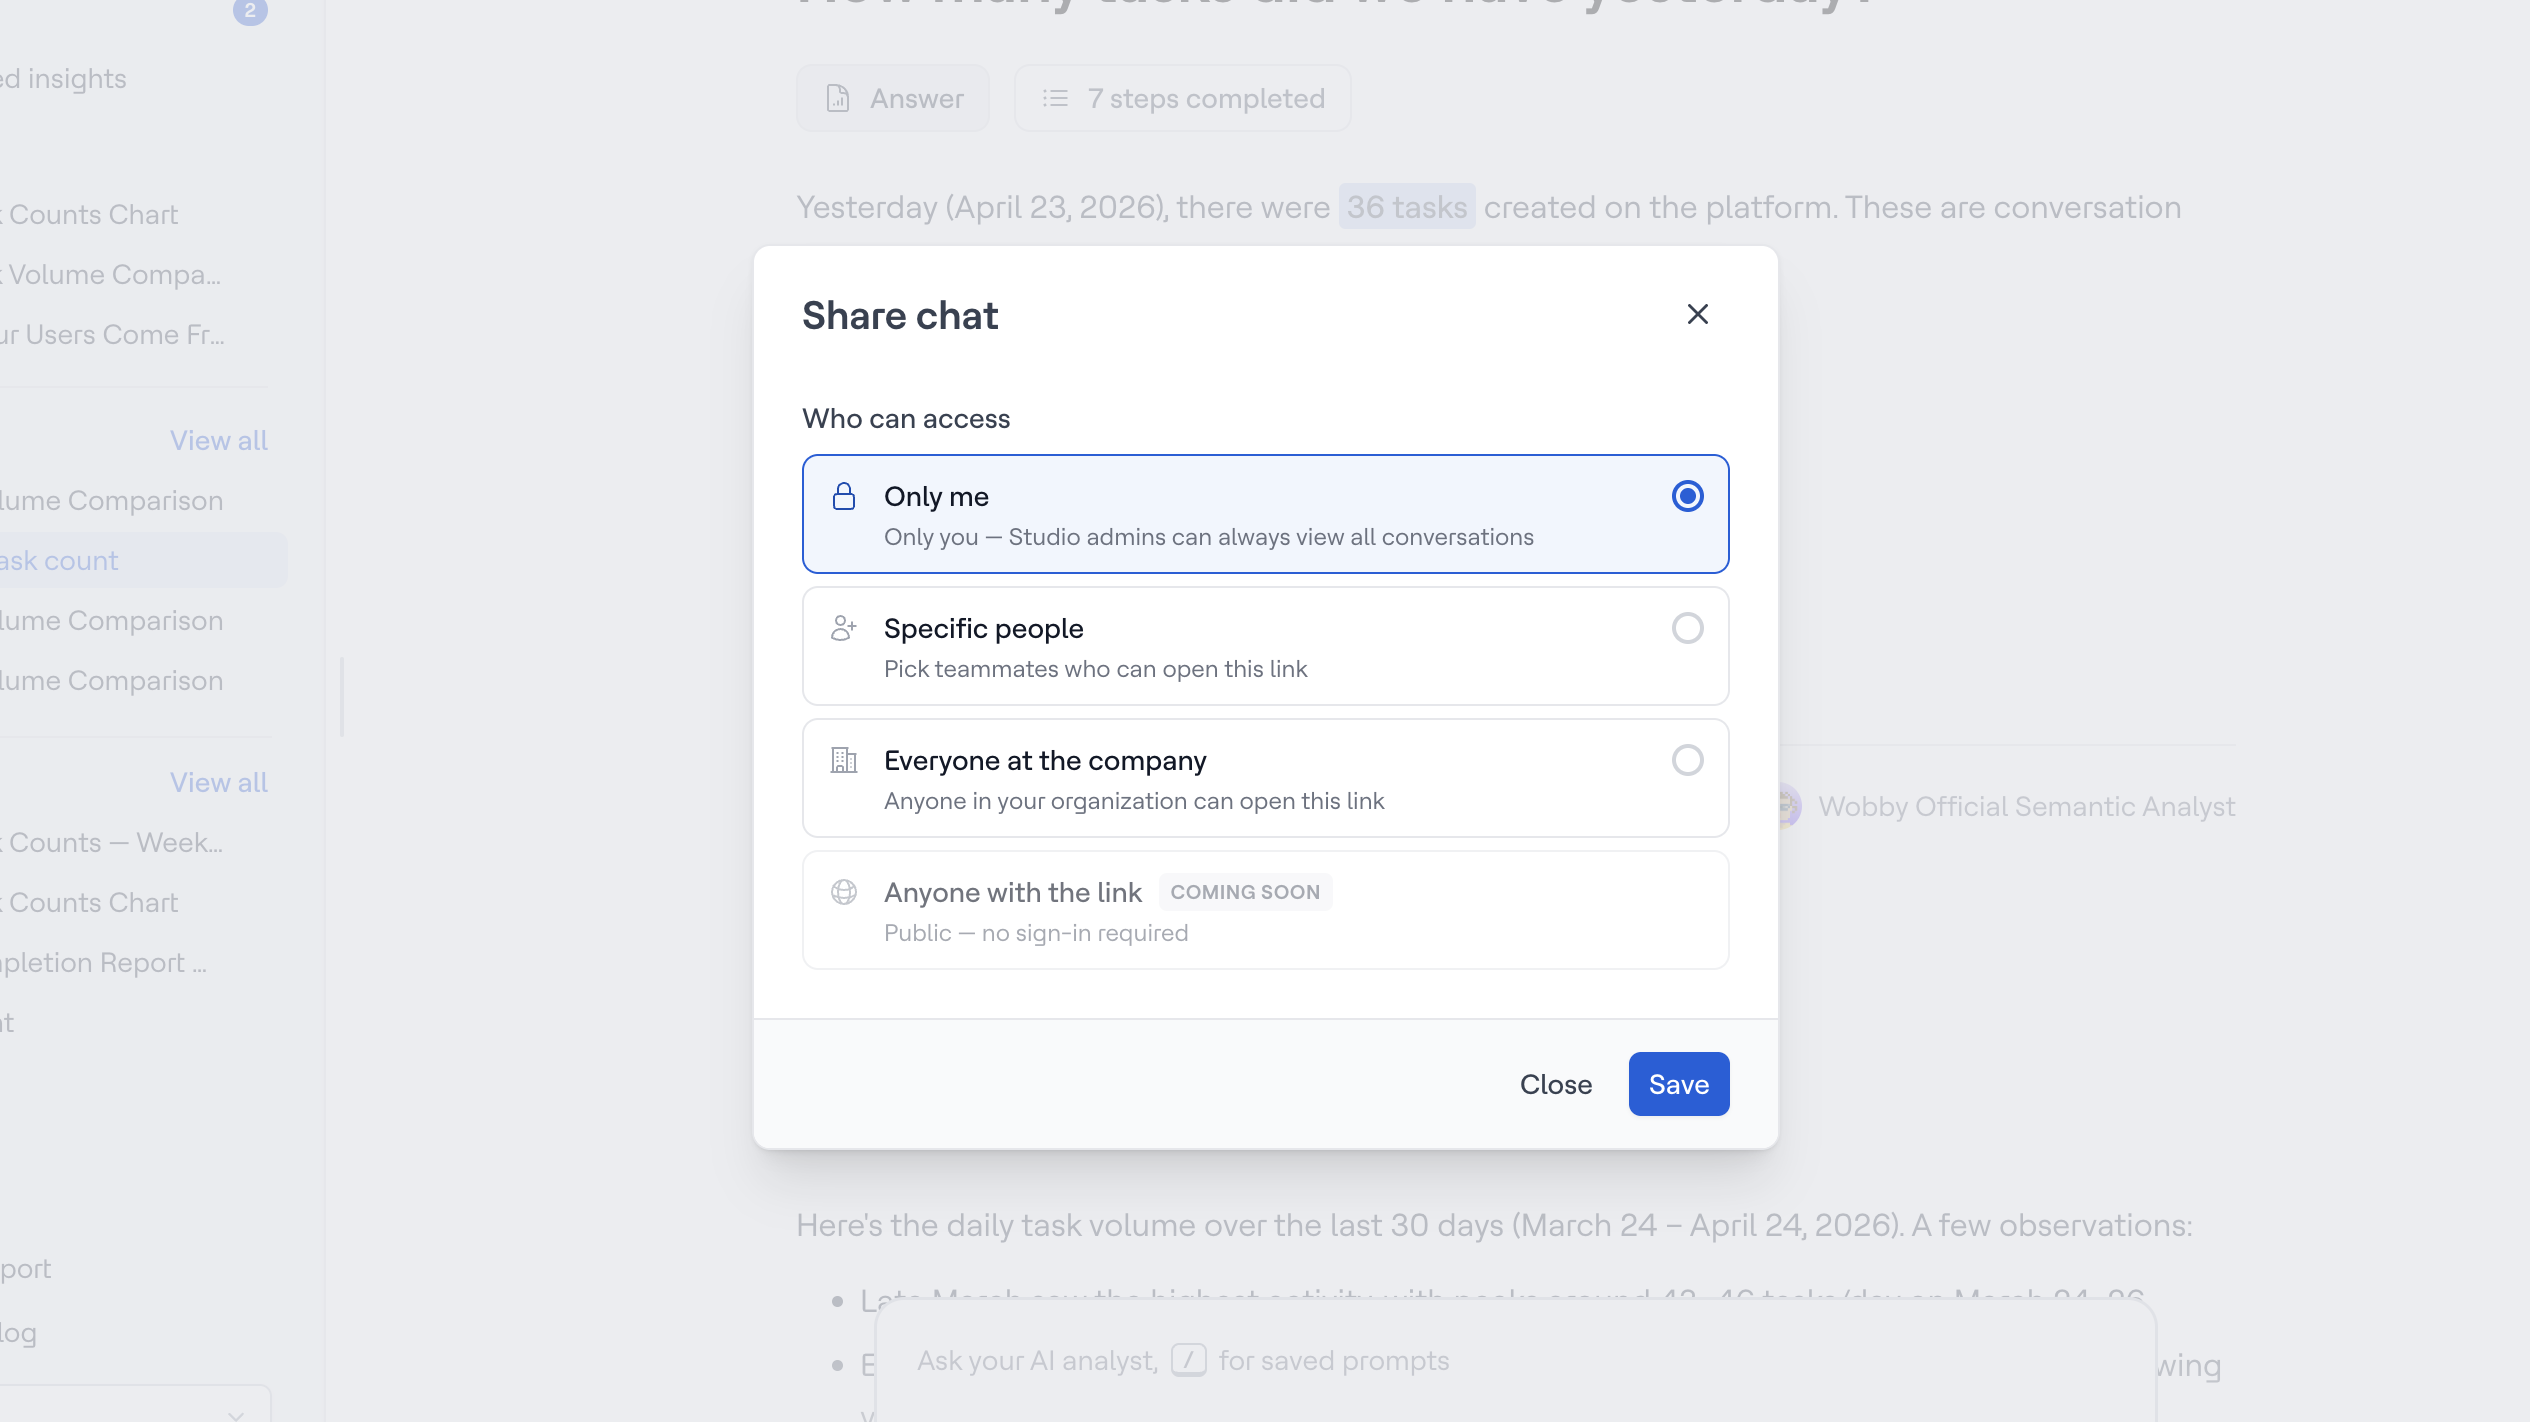
You now have granular control over who you share your chats with. Now, by default, chats and artifacts can only be seen by the person who created them, and organization administrators (Studio users).

Inbox
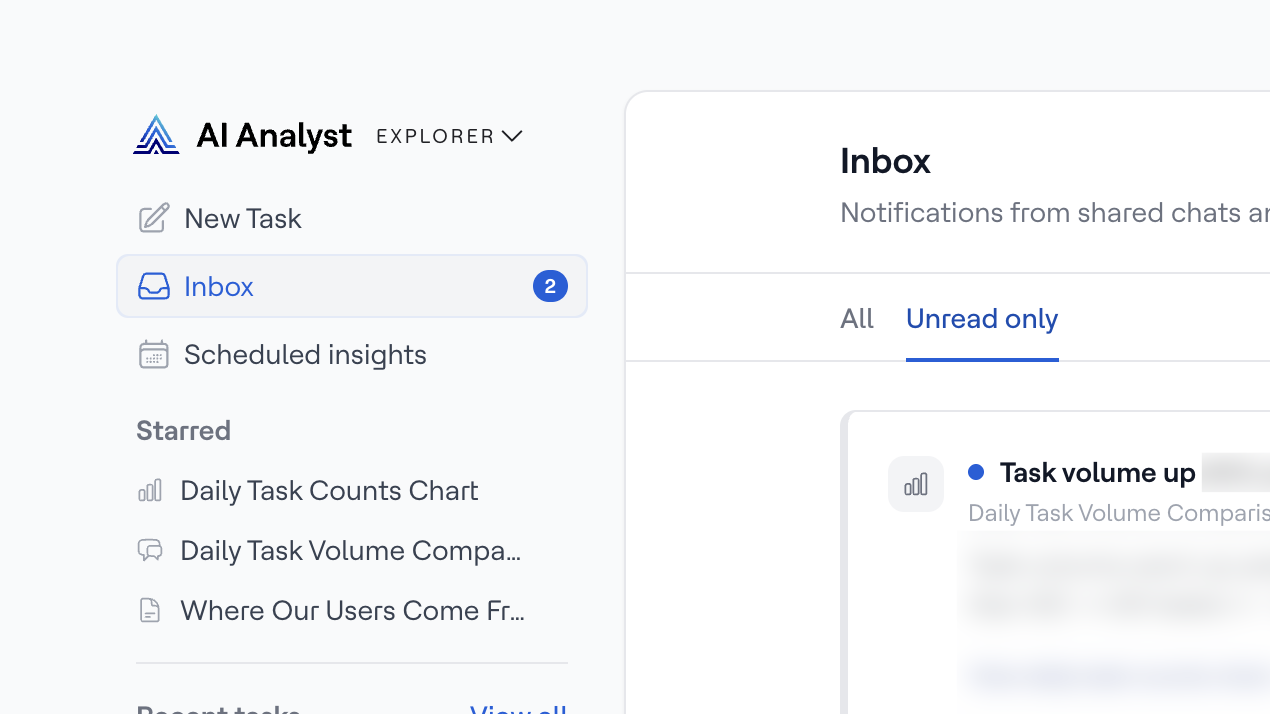
Alerts from your scheduled runs and shared chats/artifacts land in a dedicated Inbox in Explorer — a persistent, searchable feed of everything your scheduled analysts have surfaced. Each item shows which schedule it came from, what the analyst found, and (where relevant) a direct link to the chart or table behind the finding.

Improvements

  • Artifact starring
    Star charts, tables, and reports to pin the ones you use most to the top of your Artifacts library.
  • Stat cards in reports
    Reports can now include typed stat cards alongside charts and tables — useful for surfacing headline numbers directly in the report body.
  • Filter bars on Artifacts and Tasks pages
    Both pages now have a consistent filter bar: search input on the left, type dropdown, and chip toggles for Starred, Scheduled, and — new on the Tasks page — Shared with me.

Bug fixes

  • Report panel no longer force-opens on re-iteration — re-running an analysis no longer hijacks the panel if you'd closed it
  • Interrupt messages while stop button is visible — you can now type and send clarifications even while the analyst is mid-turn
  • Duplicate artifacts in chat — fixed a case where the same presented chart or report could show up twice in a message

Breaking changes

  • --deep has been removed from Slack and Teams — since Deep Analysis is no more, we have removed that flag. You can use --plan to trigger Plan Mode in Slack and Teams from now on.

As always — if anything looks off or you have feedback, send us a message.
Reports, artifacts, and spring cleaning

Haven't written here in a while! We've been busy with building interesting stuff, and doing some spring cleaning, and we hope you enjoy what we've built.

Reports that build as you chat

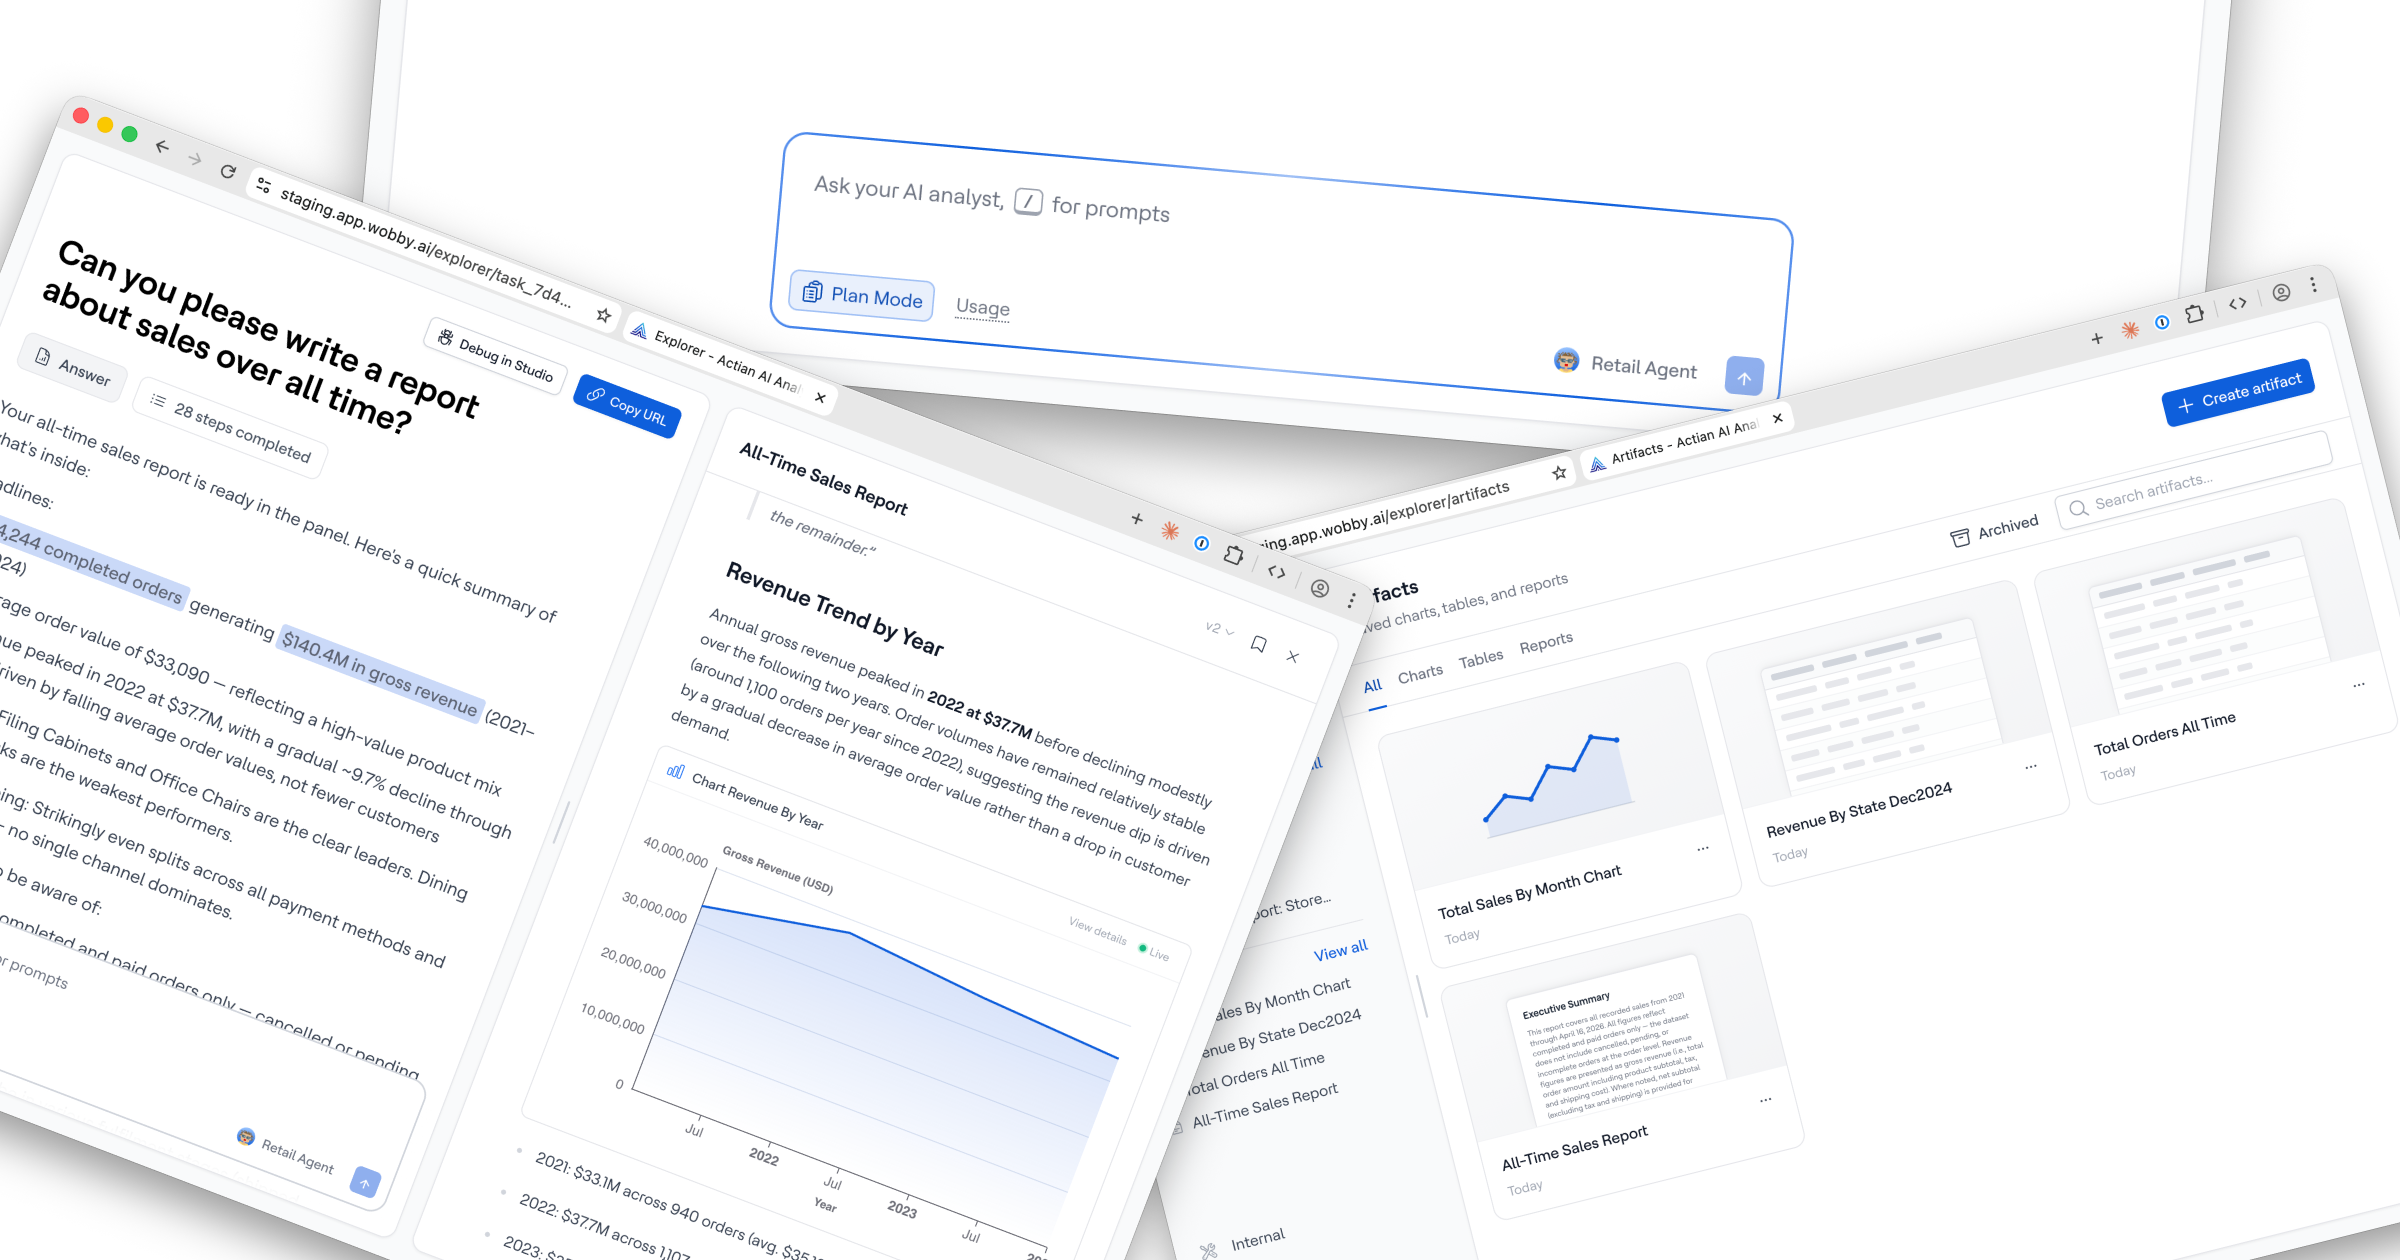
If you ever wanted to organize the charts and tables in a nice and shareable format, we have good news for you. You can now as the agent to build a report for you, which becomes a living document with insights, charts, and tables.

Between turns, the report is fully editable. Click any heading or paragraph to rewrite it. Drag blocks to reorder them. Delete the ones you don't want. Or let the analyst handle it: "add a section on the European market after the charts." Charts and tables inside reports keep their queries live — open the same report next month and the numbers update.

Try it out now — ask your AI Analyst to make a report on something, and tell us what you think.

A home for your saved work: Artifacts

Every chart, table, and report you save now lives in a dedicated Artifacts library in the Explorer sidebar. Name them, search them, filter by type, star the ones you keep coming back to.

Plan Mode, for when the question matters

For high-stakes or multi-step questions, flip the new Plan toggle next to the send button. The AI Analyst will sketch out its approach and wait for your approval before running anything. Approve it as-is, or ask it to adjust the plan first.

Plan Mode is off by default and stays on until you turn it off. Data teams can also pre-enable it on specific Saved Prompts for recurring workflows where the approach deserves a second look each time.

Goodbye, mode switching

Quick Analysis and Deep Analysis are retired. You no longer pick between a fast answer and a thorough one — the analyst figures out what the question needs. The --deep flag in Slack is gone too, and your monthly message quota is now a single number instead of two.

If you've been watching the Analytics page, "Deep Analysis %" is now marked historical — it still reflects traffic from before this release, for the curious.

As always — if anything looks off, or you just want to tell us what you're building, send us a message. More soon.

Actian Data Intelligence Platform Connector & Public API

Up until now, Actian AI Analyst has been a place you go to. Today it becomes something you can build on top of.

Public API

You can now access your semantic layer and AI Analysts programmatically. Generate an API key in Studio under Settings → API Keys, and you're off. Keys are org-scoped, support optional expiry, and can be revoked at any time.

The API exposes your full semantic layer as structured JSON or YAML: models, metrics, glossary terms, and agents. Whether you're syncing definitions into another tool, building a custom UI on top of your analysts, or automating governance workflows — the data is now yours to work with directly.

Connect your Actian Data Catalog

Your organization has probably spent real effort defining what "revenue," "active user," or "churn rate" actually means — in Zeenea, the Actian Data Intelligence Platform. Now those definitions can flow directly into your AI Analysts, instead of living in a separate tool nobody checks.

Connect your Actian Data Intelligence Platform catalog in Studio under Connections → Catalog. Once connected, your governed glossary terms — names, descriptions, synonyms, hierarchies, and links to physical data assets — sync into the Wobby glossary automatically on your chosen schedule. Synced terms show a clear "Synced from Actian" badge and are read-only in Wobby, keeping your catalog as the single source of truth. Your AI Analysts immediately benefit: they'll ground their answers in vocabulary your data team has already signed off on.

Saved Prompts

We have noticed that some of our users have started curating a small library of polished prompts for their specific use cases — different kind of reports, saved analyses, etc. Now you can keep this library in AI Analyst.

Data teams can now build a curated library of prompt templates for each AI Analyst in Studio (under the analyst's settings → Saved Prompts). Prompts support [placeholder] variables for the bits that change each time. Business users see these prompts in a new tab on the Explorer homepage — one click inserts the prompt into the chat with the placeholder already selected, ready to fill in. Typing / in the chat input also brings up a searchable dropdown of all saved prompts for that analyst.

Usage counts (last 30 days) are visible in Studio, so you can see which prompts are actually getting used and trim the ones that aren't.

Improvements

  • Line chart styling — AI Analysts can now render line charts with smooth curves instead of jagged segments, and distinguish between series using solid, dashed, or dotted strokes. Useful for overlaying actuals vs. targets, or making dense multi-line charts legible at a glance.
  • Unified notifications settings — Email and Slack notification preferences used to live on separate pages. They're now combined into a single page — each event type (Steward Inbox, Connection Failures, High Latency) has an Email and Slack toggle side by side.
  • Cleaner Slack connection page — The Slack settings page has been cleaned up and is more comprehensible.

As always, if anything looks off or you have feedback, send us a message. More soon!
And now… Steward never sleeps

Up until now, Steward has been reactive — you open a chat, ask it something, it helps. Great. But your semantic layer doesn't only need attention when you happen to ask. Dimensions break. Connections go down. AI analysts quietly struggle with metrics that aren't quite right. And none of that shows up anywhere unless someone goes looking.

Not anymore.

Steward is now proactive

Steward now runs in the background, continuously analyzing analyst conversations, monitoring your data connections, and keeping an eye on your semantic layer health. When it spots something worth your attention — a broken dimension, an unreachable data source, a recurring pattern of failed queries — it writes you a message.

Each message lands in the new Steward inbox with a clear explanation of the problem and a ready-to-go action plan. Approve the plan, and Steward gets to work fixing it. No log-digging. No piecing together what went wrong from a dozen different sessions. Just a to-do list that writes itself.

New connectors

  • ClickHouse
    ClickHouse is now a fully supported data source. Connect it, map your semantic layer on top, and your AI Analysts can start querying it right away.

  • Actian Data Platform
    Actian Data Platform (Ingres-based) is now supported as a data source, complete with a dedicated SQL dialect transpiler that handles Actian-specific SQL quirks correctly.

Improvements

  • Better AI Analyst management
    We've made it easier to keep your analysts organized: star analysts in the overview to keep your favourites front and center, a clear "Action Required" warning on analysts that aren't connected to the semantic layer yet, and Explorer now remembers which analyst you had open last.

  • Guided SemQL examples
    The "Add SemQL Example" button in glossary terms is now a smart dropdown with three paths: pull a query from an existing task, generate one with Steward, or write it manually. Cuts the confusion for teams trying to enrich their glossary without knowing SemQL by heart.

Bug fixes

  • 2FA setup is working again
    The TOTP setup flow in Security settings was broken due to an outdated API call. Fixed.
  • Language picker in Explorer
    The language selector was showing blank options. Fixed.
  • Chat history names not refreshing
    Conversation names in the history sidebar weren't updating after a rename. Fixed.
  • SemQL compiler edge cases
    The EXTRACT keyword and a handful of other parsing edge cases now compile correctly.

As always — if anything looks off or you want to share feedback, feel free to send us a quick message. Have a great week!

Goeiedag-bonjour, OSI!

Today we'd like to announce two new flashy features, both of which are about breaking down barriers. One is for language barriers, the other one — for interoperability barriers.

Open Semantic Interchange

Export and import semantic layers across tools like Snowflake, Databricks, and others. This way you can easily bring over any model definitions you might have in other tools to Wobby and vice-versa.

OSI is a very new standard, so comaptibility across different vendors may vary. Wobby currently fully supports the OSI 1.0 specification, and we will closely follow any developments to see how we can best implement them.

Read more in docs →

Five languages, one Wobby

The user interface of Wobby is now translated into five languages — English, Dutch, French, Portugese, and Japanese, with more coming. Wobby Analysts still remain polyglots, and can reply to you in practically any language.

More new features

  • @mention entities
    You can now @mention Semantic Layer entities in messages to Steward and AI Analyst instructions. These mentions keep connection even if you rename the entity.
  • Data source health monitoring
    You will now be promptly notified of any problems with connections to data sources, and have the tools to quickly diagnose and fix them.

Improvements

  • Keyboard shortcuts in many dialogs
    You might see keyboard shortcut hints on many buttons in Wobby soon, helping you move through the interface faster.
  • Steward's knowledge
    We taught Steward a bunch of things, like how to safely replace data sources in models, or how to delete stuff without breaking dependencies.
  • Geospatial Queries
    AI Analysts can now handle geospatial SQL queries with database-specific support (PostgreSQL, etc.). Previously, analysts would incorrectly refuse these requests.

Bug fixes

  • SemQL compiler now compiles
    CTEs, nested aggregations (e.g., MAX(COUNT(...))), and measure references in HAVING clauses now work as they should.
  • Knowledge graph now graphs
    It would sometimes show a blank screen.
  • Steward no longer says "I'll start working" and then immediately terminates
    We won't lie, it was pretty funny. We are, however, sorry if it happened to you — now it shouldn't.
  • Steward rollback rolls back
    It no longer fails with "Reverted 0 entities"
  • Analysts go the extra mile
    Analysis no longer prematurely terminates after 1 iteration with a false "takes too long" warning
  • ...and roughly 20 other bugs too small to explain here

Have a great week, and feel free to send us a quick message if you run into any troubles. Tot ziens!